Active until Monday, August 3. For public safety, certain trails are restricted from 8 a.m. to 5 p.m.
Greenhouse Gas Emissions
2022 Greenhouse Gas Emissions Inventory For Government Operations
The City of Phoenix recently completed the 2022 GHG Emission Inventory for Government Operations which is the fifth update to the government operations GHG emissions inventory. This shows Phoenix-wide government operations GHG emissions were 29% below 2005 levels.
2022 Inventario de Emisiones de Gases de Efecto Invernadero para Operaciones del Gobierno
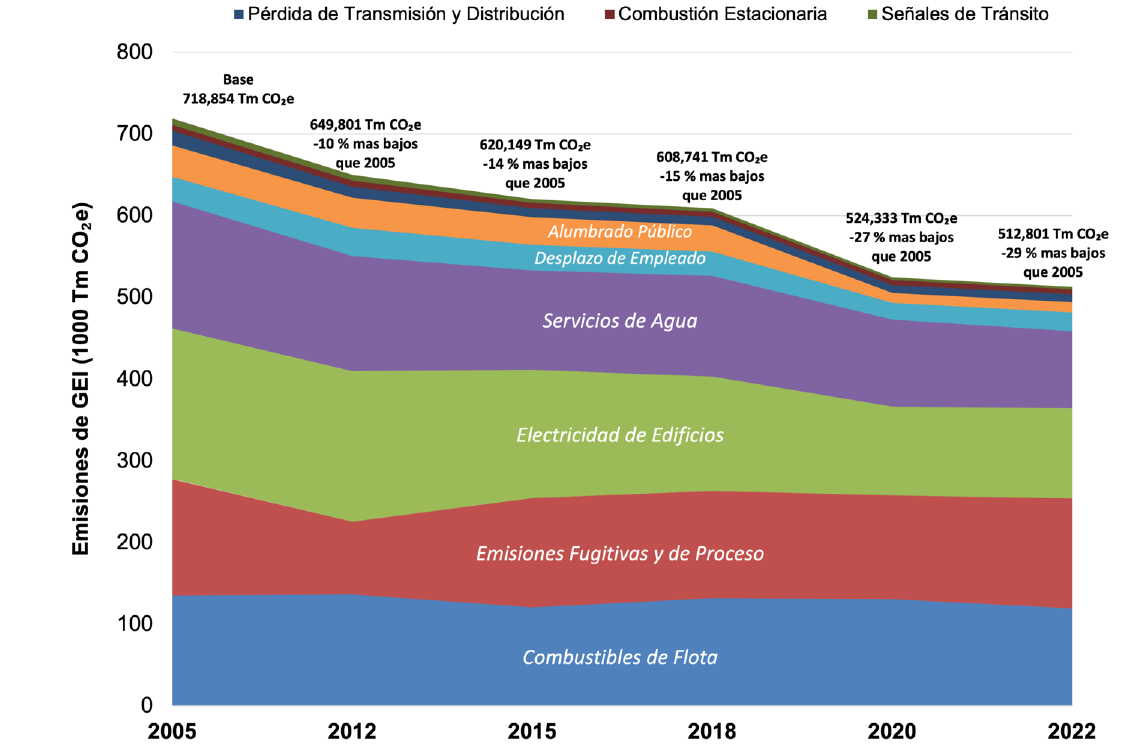
La Municipalidad de Phoenix completó recientemente el Inventario de Emisiones de GEI de 2022 para Operaciones del Gobierno cual es la quinta actualización del inventario de emisiones de GEI de operaciones del gobierno. Esto muestra que emisiones de GEI de operaciones gubernamentales eran 29% más bajas que los niveles de 2005.
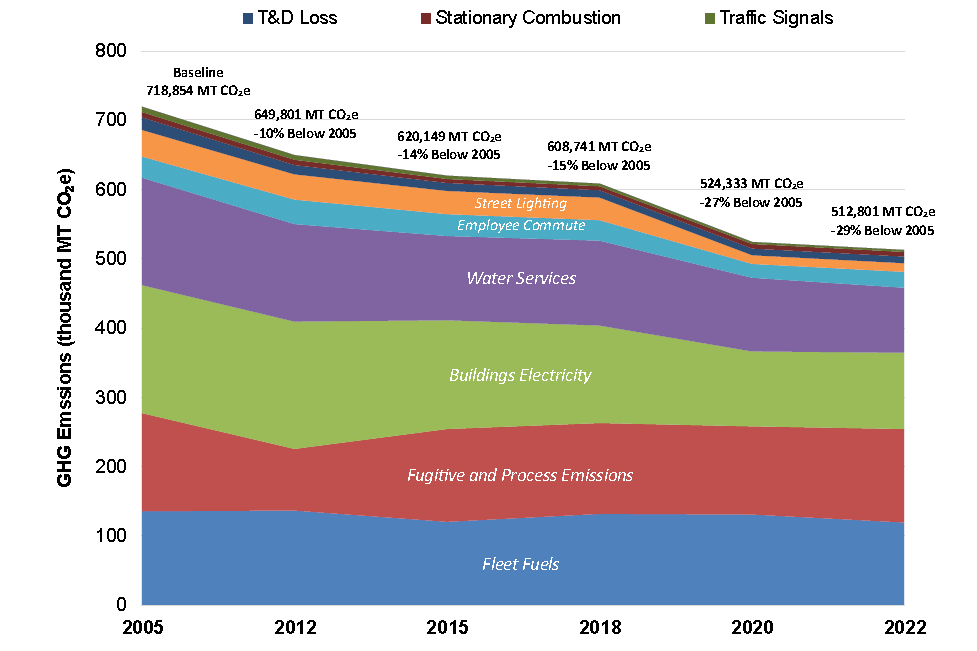
Phoenix has implemented, or is in the process of implementing, several projects in order to meet and surpass its original emissions reduction goal. These projects include:
- $16.9 million in the 27th Avenue Compost Facility.
- $30 million in LED Streetlight project replacing 100,000 streetlights
- $25 million in a biogas facility at the 91st Avenue WWTP
- $30 million in retrofits underway to reduce energy use in city buildings
- $530 million in transit since 2016 under the Phoenix Transportation Plan (T2050) for extended bus and paratransit operating hours, and increased local bus frequency to every 30 minutes or less citywide
Phoenix ha implementado, o está en proceso de implementación, varios proyectos para cumplir y superar su objetivo original de reducción de emisiones. Estos proyectos incluyen:
- $16.9 millones en instalaciones modernas para compostaje
- $30 millones en un proyecto de Alumbrado Público LED reemplazando 100,000 luces
- $25 millones en instalaciones de biogas en 91st Avenue WWTP
- $30 millones en modernizaciones de eficiencia energética en edificios de la municipalidad
- $530 millones en transporte público desde 2016 bajo el Plan de Transporte de Phoenix (T2050) para ampliar el horario de autobuses y paratránsito, aumentando la frecuencia de autobuses a 30 minutos o menos en toda la ciudad.
Between 2005 and 2022, the City's population increased by 12.8%. Some government operation GHG emissions are population dependent – e.g., aspects of solid waste disposal, wastewater treatment and discharge, and vehicle fleet emissions. Even with the population growth, government operations GHG emissions reductions have been achieved with 41% fewer GHG's per resident than in 2005. GHG emissions from Phoenix government operations have decreased due to multiple factors:
- 43% fewer emissions from electricity consumption;
- 13% fewer emissions from natural gas combustion;
- 5% fewer emissions from landfills and wastewater treatment
De 2005 a 2022, la población de la municipalidad aumentó 12.8%. Las emisiones de GEI de algunas operaciones gubernamentales dependen de la población – p.ej., aspectos de la eliminación de desechos sólidos, el tratamiento y la descarga de aguas residuales y las emisiones de la flota de vehículos. Incluso con el crecimiento de la población, se han logrado reducciones de emisiones de GEI con un 41% menos de GEI por residente que en 2005. Las emisiones de GEI de las operaciones del gobierno de Phoenix han disminuido debido a múltiples factores:
- 43% menos emisiones por consumo de electricidad;
- 13% menos emisiones de la combustión de gas natural;
- 5% menos de emisiones de vertederos y tratamiento de aguas residuales
2022 Greenhouse Gas Emissions Inventory Community-Scale
The 2022 Community-Scale GHG Emission Inventory, which is the fourth update, shows Phoenix-wide GHG emissions to be 15,804,670 metric tons of carbon dioxide equivalents (MT CO2e ), a 10% reduction in the overall GHG emissions and a 20.5% reduction in per capita GHG emissions compared to the 2012 levels. GHG emissions decreased 10% during a period when the City's population grew 12.8% and the metro area economy grew 54%.
Inventario de Emisiones de Gases de Efecto Invernadero a Escala Comunitaria de 2022
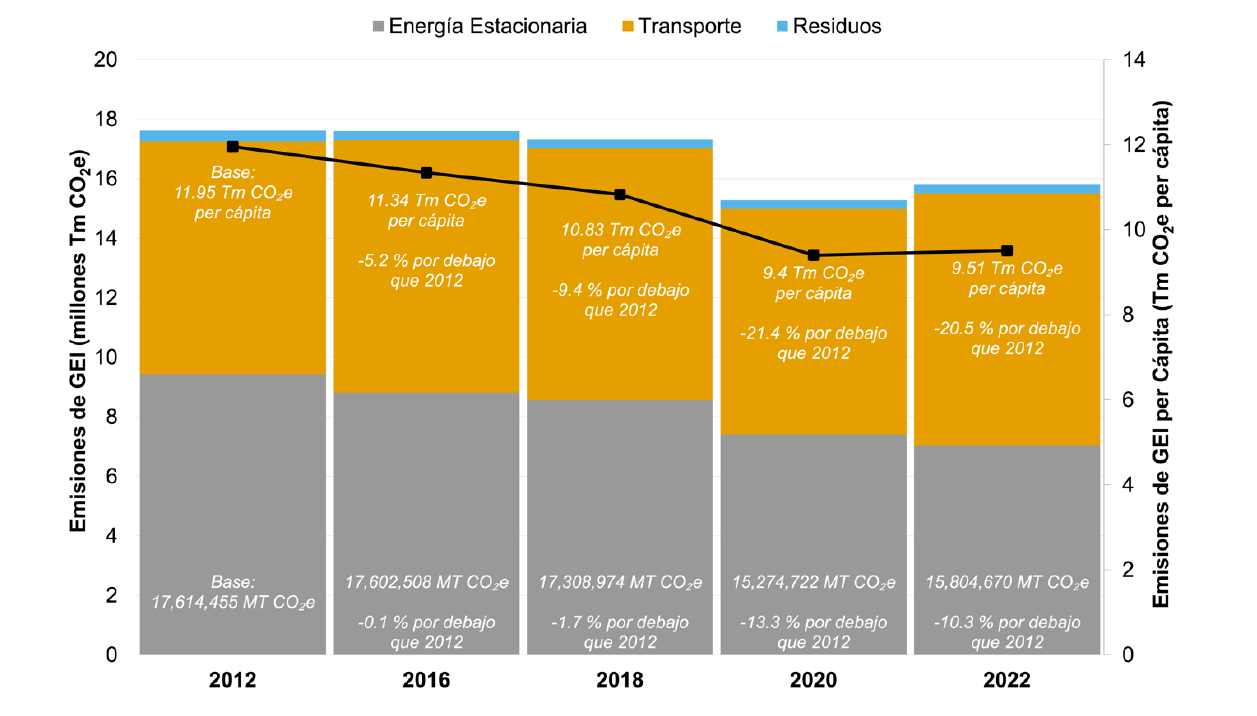
El Inventario de Emisiones de Gases de Efecto Invernadero a Escala Comunitaria de 2022, cual es la cuarta actualización, muestra que las emisiones de GEI en todo Phoenix son 15,804,670 toneladas métricas de equivalentes de dióxido de carbono (Tm CO2e), una reducción del 10% en las emisiones totales de GEI y una reducción del 20.5% en las emisiones de GEI per cápita en comparación con los niveles de 2012. Las emisiones de GEI disminuyeron 10% durante un período en el que la población de la ciudad creció 12.8 % y la economía del área metropolitana creció 54%.
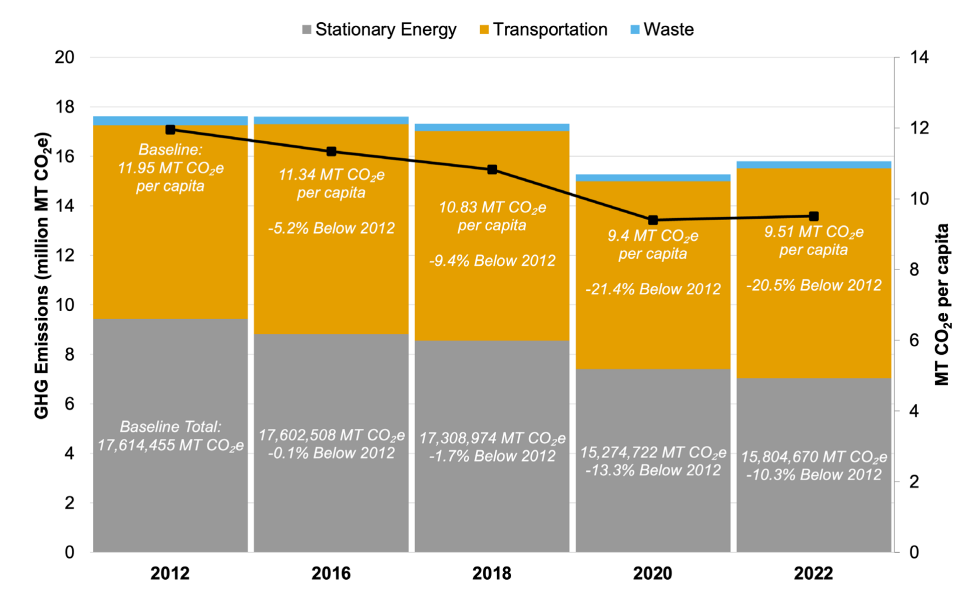
Stationary Energy GHG emissions decreased 25% below 2012 levels, driven by a less GHG-intensive regional electricity grid.
Las emisiones de GEI de Energía Estacionaria disminuyeron un 25% por debajo de los niveles de 2012, impulsadas por una red eléctrica regional menos intensiva en GEI.
The Transportation Sector is the largest source of GHG emissions in Phoenix in 2022, representing more than half of all emissions, and increased 8% since 2012. The largest source of Transportation Sector GHG emissions is gasoline and diesel use in private vehicles. Community-wide transportation activity saw a rebound from the pandemic-induced lows of 2020. Transportation GHG emissions have increased across Phoenix since 2012 as these emissions increase with population growth.
El Sector del Transporte es la mayor fuente de emisiones de GEI en Phoenix en 2022, que representa más de la mitad de todas las emisiones, y aumentó 8% desde 2012. La mayor fuente de emisiones de GEI del Sector Transporte es el uso de gasolina y diésel en vehículos privados. Se observó un repunte en la actividad de transporte a nivel comunitario tras las disminuciones provocadas por la pandemia de 2020. Sin embargo, las emisiones de GEI provenientes del sector de transporte han aumentado en Phoenix desde 2012, ya que estas emisiones se incrementan con el aumento de la población.
Waste Sector GHG emissions are small compared to the Stationary Energy and Transportation sectors and decreased 18.3% since 2012. While Solid Waste GHG emissions will occur from the ongoing disposal of solid waste, closed landfills within the City produce less GHG emissions as the waste decays. Additionally, the capture and reuse of flared methane biogas at the 91st Avenue Wastewater Treatment Plant led to a decrease in wastewater treatment GHG emissions despite Phoenix's population growing significantly between 2012 and 2022.
Las emisiones de GEI del Sector de Desechos son pequeñas en comparación con los sectores de Transporte y Energía Estacionaria y disminuyeron 18.3% desde 2012. Mientras las emisiones de GEI de desechos sólidos se producirán a partir de la eliminación continua de desechos sólidos, los rellenos sanitarios cerrados dentro de la ciudad producen menos emisiones de GEI a medida que los desechos se descomponen. Además, la captura y reutilización de biogás de metano quemado en la planta de tratamiento de aguas residuales de 91st Avenue condujo a una disminución en las emisiones de GEI del tratamiento de aguas residuales a pesar de que la población de Phoenix creció significativamente entre 2012 y 2022.
2020 Inventories
- 2020 Community-Scale GHG Emissions Inventory
- 2020 GHG Emissions Inventory for Government Operations
- 2020 GHG Emissions Inventory - Executive Summary
- Inventario de Emisiones de Gases de Efecto Invernaderoa Escala Comunitaria de 2020
- 2020 Inventario de Emisiones de Gases de Efecto Invernadero para Operaciones del Gobierno
- Inventario de Emisiones de Gases de Efecto Invernadero de 2020 – Resumen Ejecutivo
2018 Inventories
2016 Inventories
2015 Inventories
2012 Inventories
2005 Inventories
Do you have questions or comments on the City's climate actions or planning? Do you have other ideas or suggestions? Contact us at climate@phoenix.gov
¿Tiene preguntas o comentarios sobre las acciones climáticas o la planificación de la Ciudad? ¿Tienes otras ideas o sugerencias? Contactanos en climate@phoenix.gov